Sanger Troubleshooting
Meaningful Information in your results folder:
The Q20 is the number of bases having a Phred score Q20 which is an error rate of 1 in 100 or accuracy of a base call of 99%
-
- Plasmid sequences with good quality will have a Q20 number of 700 and above and G signal 400-3000
- PCR product sequences will have a Q20 number 20-50 lower than the PCR product length
The G signal intensity column or G Sig:
-
- Good signal intensities will be between 400-6000.
- Signal intensities below 150 are within the standard background range of our instrument and may not be reliable sequence.
- Signal intensities above 6000 may have too much DNA in the sequencing reaction and will cause errors in basecalling.
Most common reasons Sanger Sequencing samples fail:
- Inadequate template concentration
- NanoDrop readings too low to be accurate
- Failure to check PCR product concentration
- Inexperience at gel estimation of band intensity
- NanoDrop reading with excessive RNA present
- Overloading miniprep purification column, leading to loss of peak resolution.
- Primer concentration off due to calculation error
- Sequencing incorrect PCR product(s)
- Secondary structure within clone
- Homopolymer tract
- Primer dimers
- Contaminants in samples from sample prep; salt, EtOH, dNTP’s, Phenol etc
Quantifying your DNA is key to success:
- Quantifying your DNA using NanoDrop
-
- The NanoDrop has a reliable lower limit of detection of ~ 10ng/uL, reading below this are often NOT reliable.
- Contaminants such as RNA, genomic DNA and salts can over-estimate the concentration of DNA because they absorb at or around 260nm.
- Good quality DNA has a A260/280 ratio of 1.8-2.0. Lower ratios indicate contaminants like protein and phenol that absorb at 280 nm.
- Good quality DNA has a A260/230 ratio around 2.0-2.2. Lower ratios indicate the presence of organic contaminants like salts, TRizol, EB, EDTA and carbohydrate.
- Quantifying PCR products by NanoDrop may not be possible due to the detection limit is 10ng/uL, quantities below this are not reliable. If you are purifying your PCR products prior to Sequencing: ensure that all leftover primers from the PCR reaction, unicorporated nucleotides, enzyme, buffer and salts are completely removed. When using EtOH precipitation, make sure to remove any residual ethnol; EtOH can bind to unicorporated dyes in the sequencing reaction which can lead to dye blobs and basecalling errors. If your PCR reaction contains one specific product on a gel ExoSap is a good method for removing free primer, dNTPs and does not result in further loss of product. The best method for determining the concentration of your PCR products is by gel using a mass standard.
- Fluorescent Quantification- i.e. Invitrogen Qubit
- Contaminants are less likely to affect quantification
- Better for PCR product quantification as lower limits are in pg/uL range
Sample preparation:
- Prepare samples by adding the appropriate amount of template and primers to water (i.e., not TE or Tris buffers). We highly recommend the purified template to be suspended in water or a diluted TE (2 mM Tris + 0.1 mM EDTA).
- Water or diluted TE should be used to elute templates from the purification columns or suspend templates following ethanol precipitation.
- Sequencing results have been found to be inconsistent when template and/or primer are dissolved in TE (10 mM Tris and 1.0 mM EDTA). EDTA chelates Mg2+ ions and subsequently inhibits our reaction enzyme.
- Reducing the EDTA to 0.1 mM will not inhibit the enzyme and will give more consistent sequencing results.
- The use of buffers such as 10 mM Tris can inhibit sample loading into the sequencing machine due to the electrophoretic loading by the machine. We suggest using 2mM Tris as a buffer for template and primers that will be used in a sequencing reaction if you can’t use water.
- Contaminants such as EDTA, SDS, and NaCl all strongly inhibit Sanger Sequencing.
Common error phenotypes in chromatograms
Too Much DNA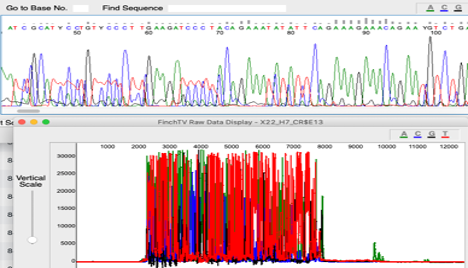
Possible Causes:
- Too Much DNA
Corrective Action:
- Dilute Samples
Mixed product or Double Sequence
Possible Causes:
-
- Multiple colonies
- Multiple PCR products
- Multiple primer binding sites/non-specific primer binding
- Insertions or deletions if PCR from a diploid organism
Top Heavy or Ski slope effect
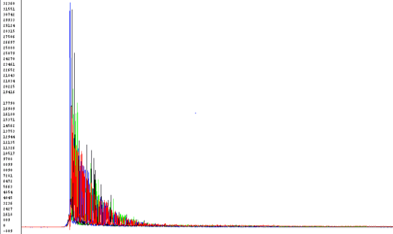
Possible Causes:
- Most often: template/primer ratio is off, too much template or primer
- High Salt concentration
- Ethanol contamination
- EDTA concentration too high
Corrective Action:
- Quantitate samples
- Dry spin column longer
- Re-precipitate DNA and perform an 80% Ethanol wash
- Elute in water
- If DNA obtained from gel extraction, perform an extra wash
Secondary Structure- Mid Sequence Drop off/hard stop
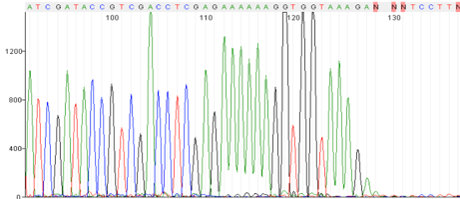
Possible Causes:
- Secondary Structures (stem loops, hairpins, palindromes)
- RNAi region
- GC rich region
Corrective Action:
- Sequence from the other direction
- Linearize DNA
Repeats and Homo polymer runs

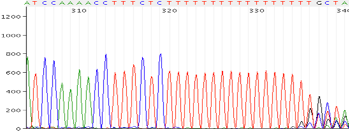
Possible Causes:
- Polymerase is slipping
Corrective Action:
- Sequence is the opposite direction
- Design new primer in a different region
No comments to display
No comments to display